How new corona cases impact local behavior
Post by Ulf Aslak. Published: Aug, 19, 2020.There have been two recent, highly publicized outbreaks of COVID-19 in Denmark; one in Aarhus and another in Ringsted. Both outbreaks started around the same time, approximately on July 28. Both are highly localized, the one in Ringsted, among workers at a butchery and the one in Aarhus was among visitors to a cultural center. The outbreaks may be related to so-called ‘superspreading’ events, and regardless of their specific nature, these local flare-ups are events that we expect to happen based on how we understand viruses spread when the fraction of susceptible individuals is very high.
Both spreading events received a large amount of media attention, and with overall case numbers going up on the affected - and nearby - regions, new lockdown restrictions were - and are - being advertised by government and municipalities. As we learned early on, lockdown strongly impacts travel patterns. And though potential restrictions have been advertised, no serious restrictions have been imposed yet. Any sign of behavioral change we can detect in our data is, therefore, mostly due to people’s own choices.
In this blog post we investigate the impact of increasing corona cases and renewed media attention on travel inside different municipalities of the country.
The first media mention of new COVID-19 cases occured on July 29 in connection to the Ringsted outbreak. Later on August 3, a soccer win celebration in Aarhus was connected to rapidly rising case numbers.
A look at case numbers
The figure below shows the number of newly infected since July 28 per 100.000 inhabitants, for the six most affected municipalities.
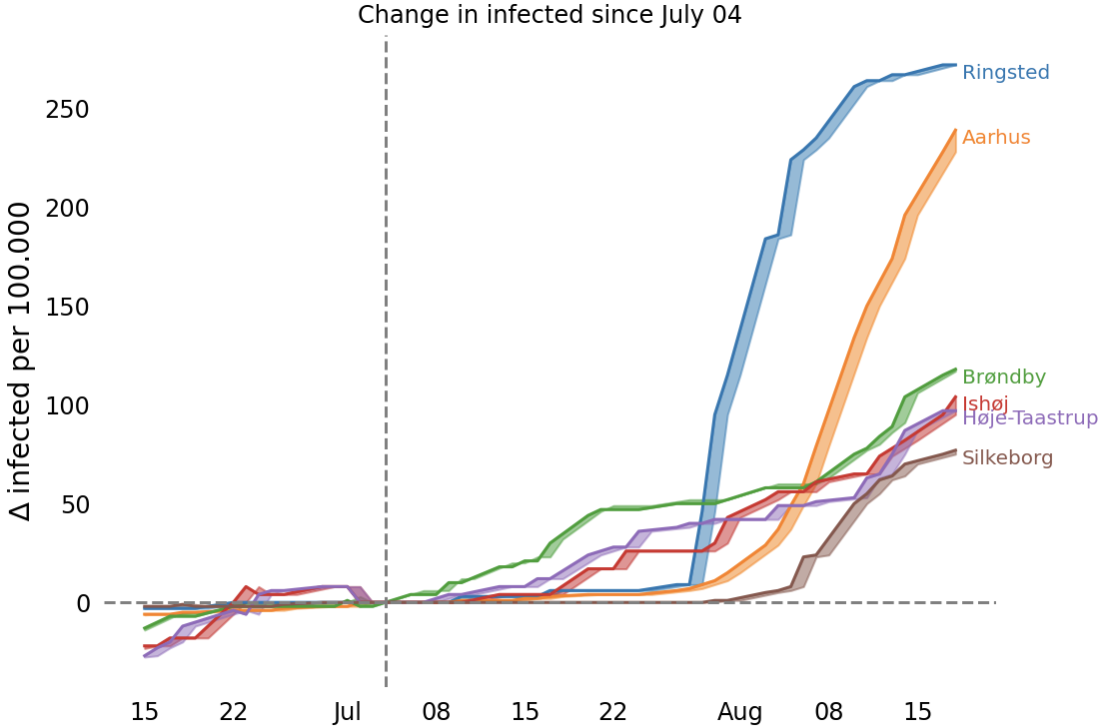
Relative case number increase since July 28 in the five most affected municipalities. Shaded regions indicate new cases since last reading. Aarhus and Ringsted, where initial superspreading occured, stand apart but other municipalities like Silkeborg (neighbor of Aarhus), and Ishøj and Brøndby (near Copenhagen) have increasing numbers of infected.
Since almost all media attention has focused on Aarhus and Ringsted, this figure is somewhat reassuring. Aarhus and Ringsted visibly stand apart in case numbers. Note also that the case number increase has stabilized to a linear increase in these places, and has seemingly ceased in Ringsted.
Do people stay at home?
The most interesting measure of travel to inspect in relation to growing case numbers, is the degree to which people stay at home during the day. Read about how we measure this in the Going out visualization page. The two plots below are screenshots from that section of our website. Note that the curves are smoothened to a seven-day average to reveal trends.
Looking at how much people leave their home during daytime in Aarhus, Ringsted and Ishøj compared to the whole country as a baseline, it is clear that, following July 28, a collective drop seems to occur. This is good news. Aarhus and Ringsted have received most of the medias attention, and this seems to have had an effect on the people’s behavior.
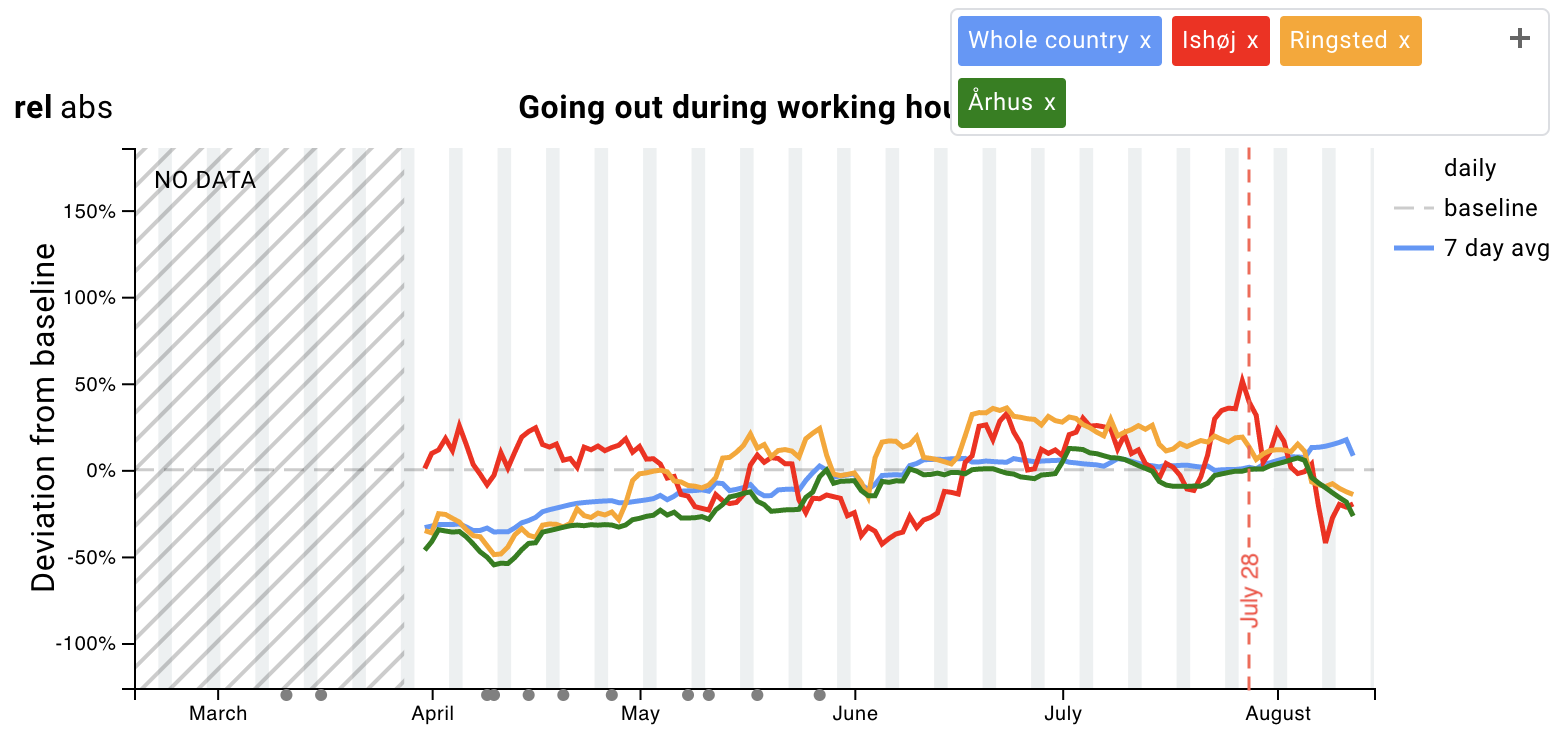
Deviation in how much people leave home during the day in Aarhus, Ringsted and Ishøj. The vertical dashed line indicates July 28 where case numbers suddenly rose.
Reversely, when we visualize the same metric for Silkeborg and Brøndby who are also in the top five of affected municipalities the opposite happens. Here, the number of people that spend time away from their homes during the day appears to increase.
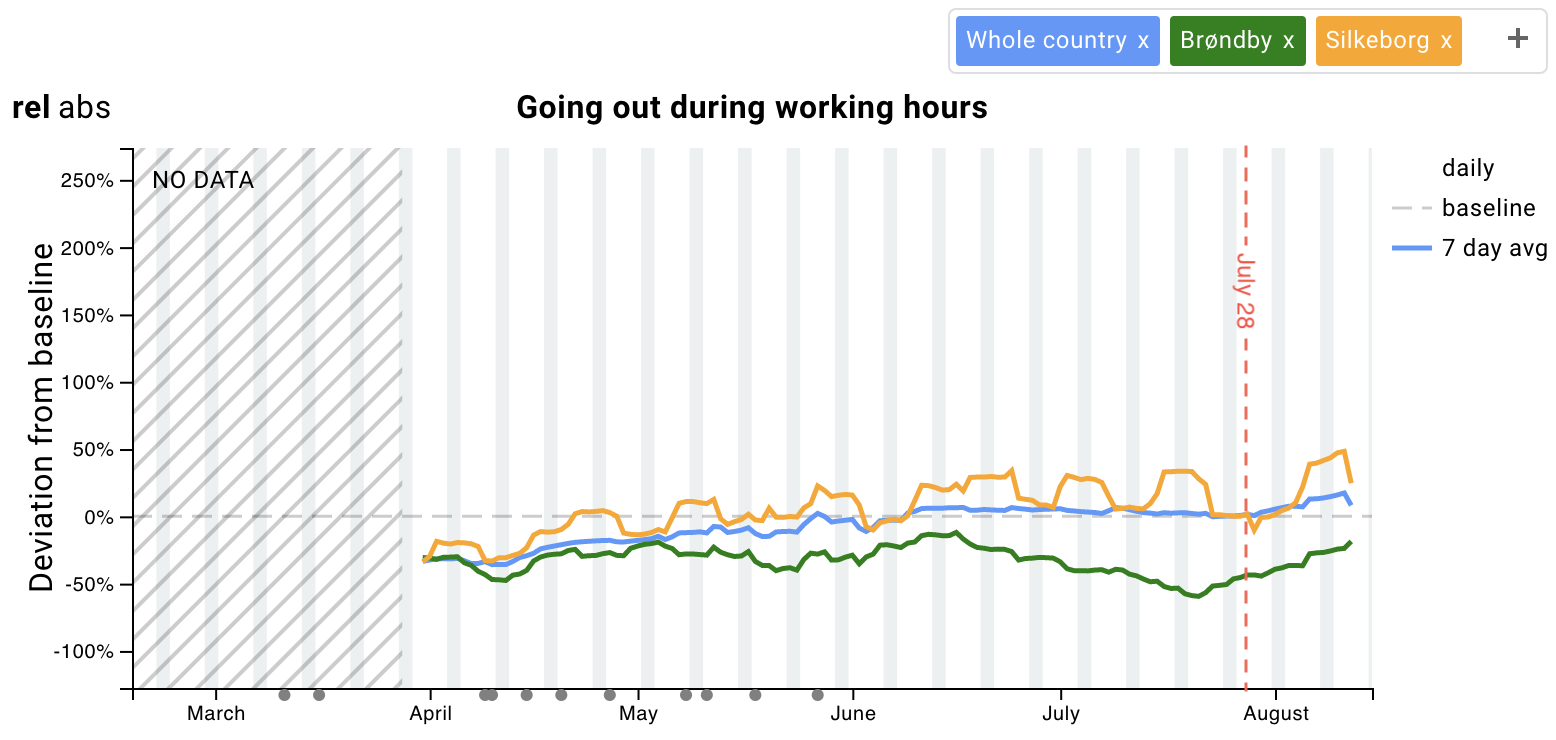
Deviation in daily distance traveled for people in Brøndby and Silkeborg.
People react differently across the country
To create an overview of how people in different parts of the country react to information about new case numbers, we visualize how their “going out during the day” behavior changes over time as case numbers increase. In the visualization, each circle represents a municipality, and the area of each circle on a given date corresponds to the total number of new cases in that municipality on that day. As you drag the time-slider, starting July 28, you see case numbers increase (circles going up) and “going out” behavior change (move left or right). Ideally, we should observe that circles move left as they go upwards. Circles moving left means that their inhabitants react to information about new cases of COVID-19 and self-quarantine accordingly. The percentage change on each day is relative to the average activity on four prior same weekdays.
Things to discover in this plot:
- There is no apparent correlation between cases and behavior. We might have expected to see that more affected municipalities reduced going out behavior more, but this is only really the case for Aarhus and Ringsted. And in Ringsted even, this is only the case on weekends.
- Aarhus is by far the biggest container of new corona cases. Accordingly, it is also the municipality where we see the clearest indication of self-quarantine in both weekdays and weekends.
- No noticable change in behavior in Copenhagen (København). In fact there is a slight increase in activity.