Going out/Staying home
Post by Jonas Lybker Juul. Published: May 18, 2020.The COVID-19 pandemic has impacted nearly every part of a typical Danish life. Among all the major disruptions, perhaps the biggest has been the impact the outbreak has had on working lives.
At the peak of the Danish lock-down, most public employees (all except for those carrying out tasks of a critical nature) and an estimated one-third of people working in the private sector, were working from home. Read that one more time. One out of every three people working in the Danish private sector were working from home – voluntarily!
So the nation-wide impact on working habits is huge, but there is much more to be learned. Using the Going out and Staying home visualizations, we can 1) explore where the Danes spend their times during working hours; 2) Compare the observations to how Danes were spending this time in February; and 3) Investigate regional differences and changes over time – are things slowly going back to normal?
There’s many interesting things to be said from these visualizations and after reading this post, we encourage you to dive into this yourself. First, however, we go through a few of the observations we have found particularly thought-provoking.
Observation 1: On a nation-wide scale, behavior seems to slowly converge back to normal
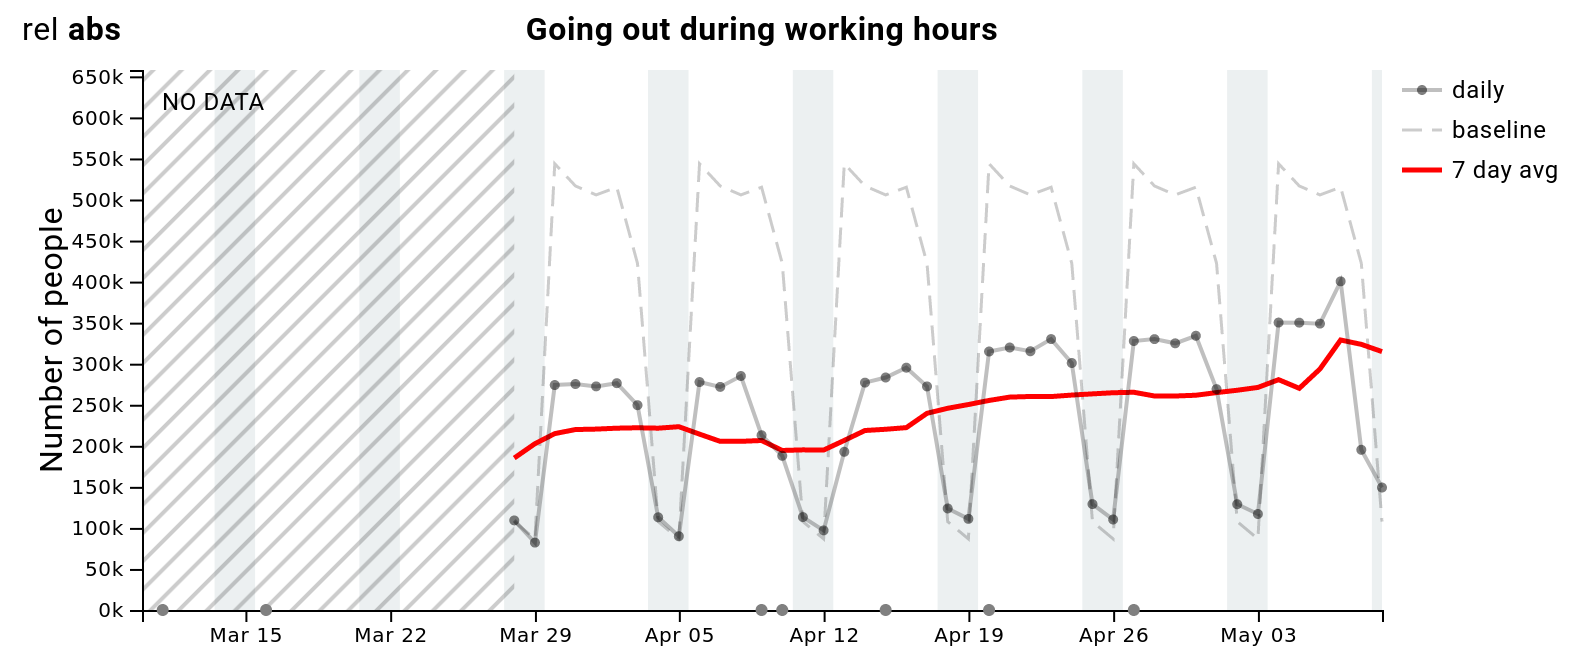
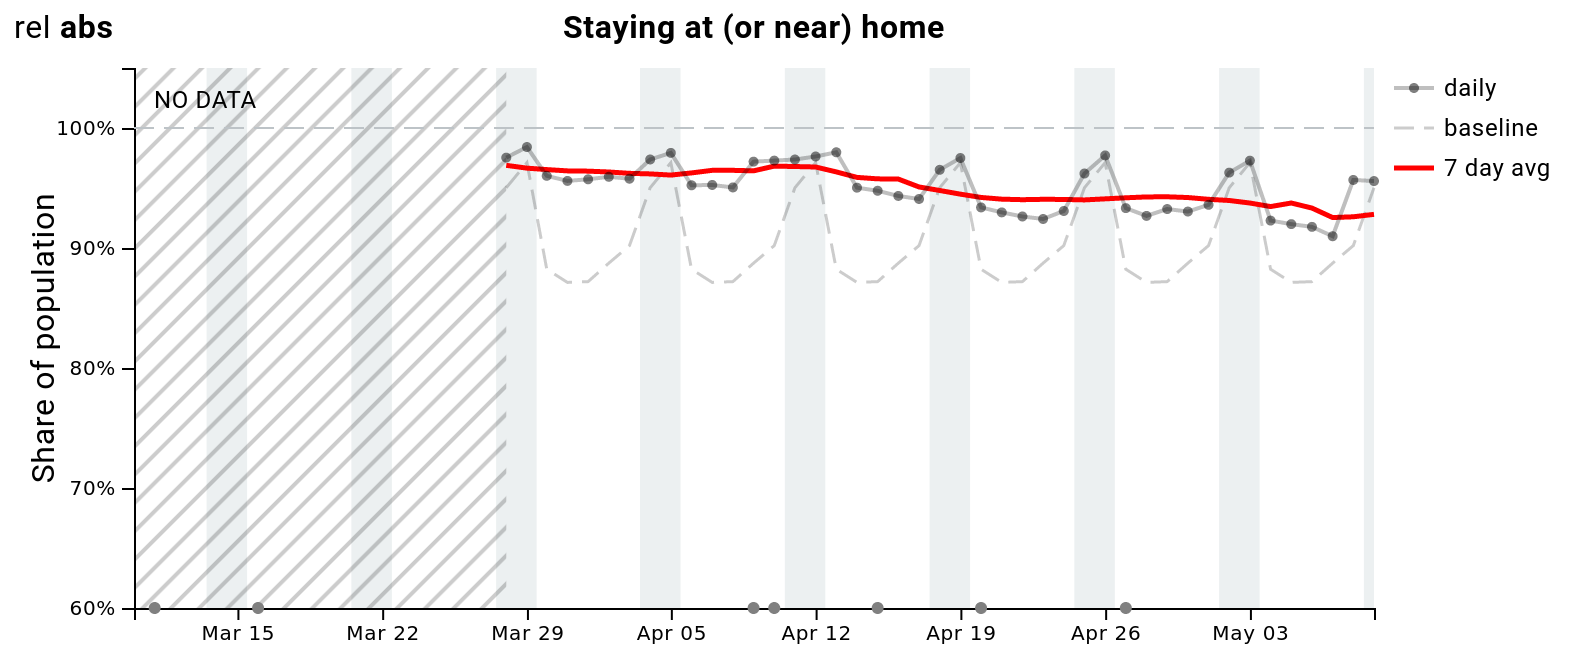
Before the new virus made its appearance in Denmark, there were clear differences between weekdays and weekends: While moving about between Monday and Friday, Danes would stay home over the weekend. While such differences still exist, the discepancy between weekends and weekdays is much smaller during the emergency. Since the end of March, however, the weekly oscillations have consistently gained amplitude. The left-hand panel above illustrates that this is true for the tendency for people to go out, whereas the right-hand panel above shows that the same is true for the number of people staying at home during work hours. These plots probably indicate a slow convergence back to normal.
Observation 2: There are very clear regional differences in the return to normal
The above figures illustrated behavior patterns on a national scale. One of the things we find most fascinating about the Danish behavior change, is the captivating regional heterogeneity visible in the data. As you can check for yourself, the oscillatory pattern distinguishing weekends from weekdays is clearly visible in some of the major cities, including Copenhagen.
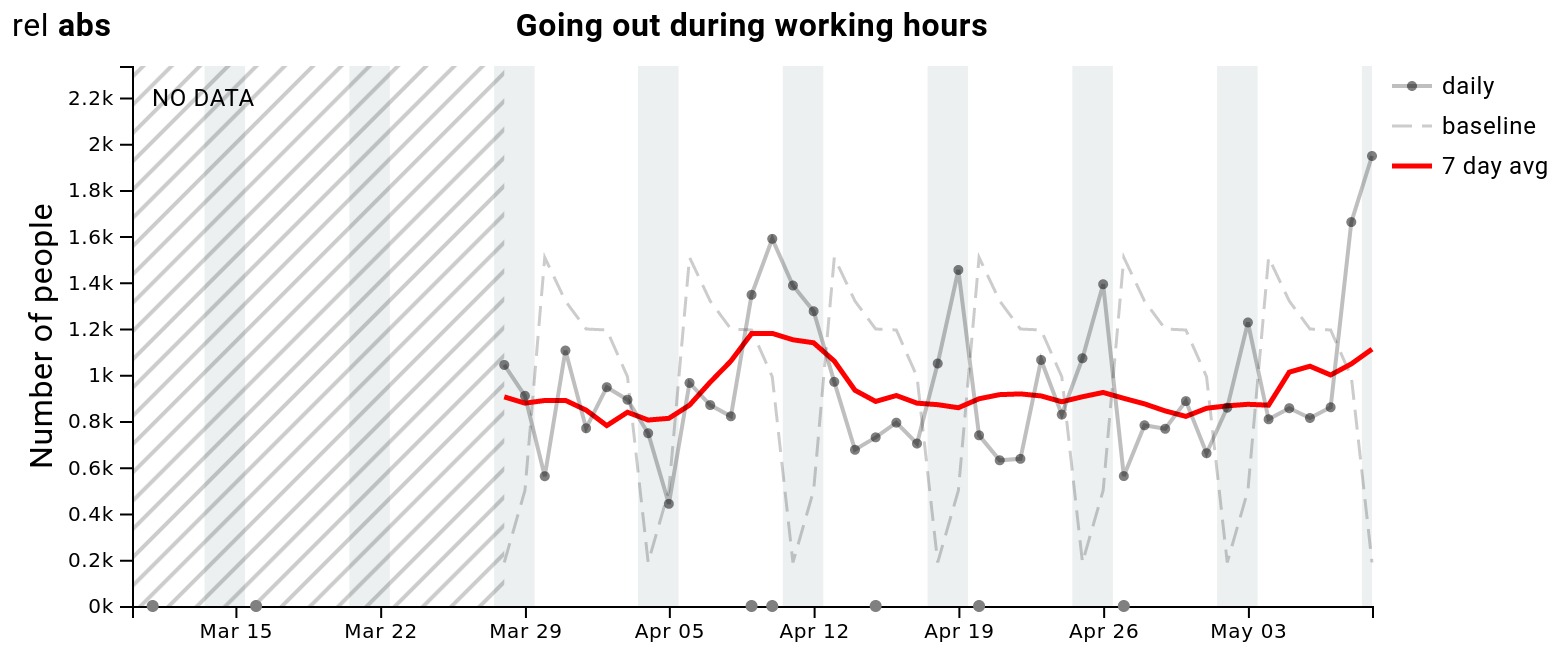
Looking away from the major cities, however, data shows something totally unexpected! As illustrated below, the people of Norddjurs going out during work hours are currently perfectly out of phase with their baseline behavior (and the rest of the population)!
Observation 3: What’s up with the weekends?
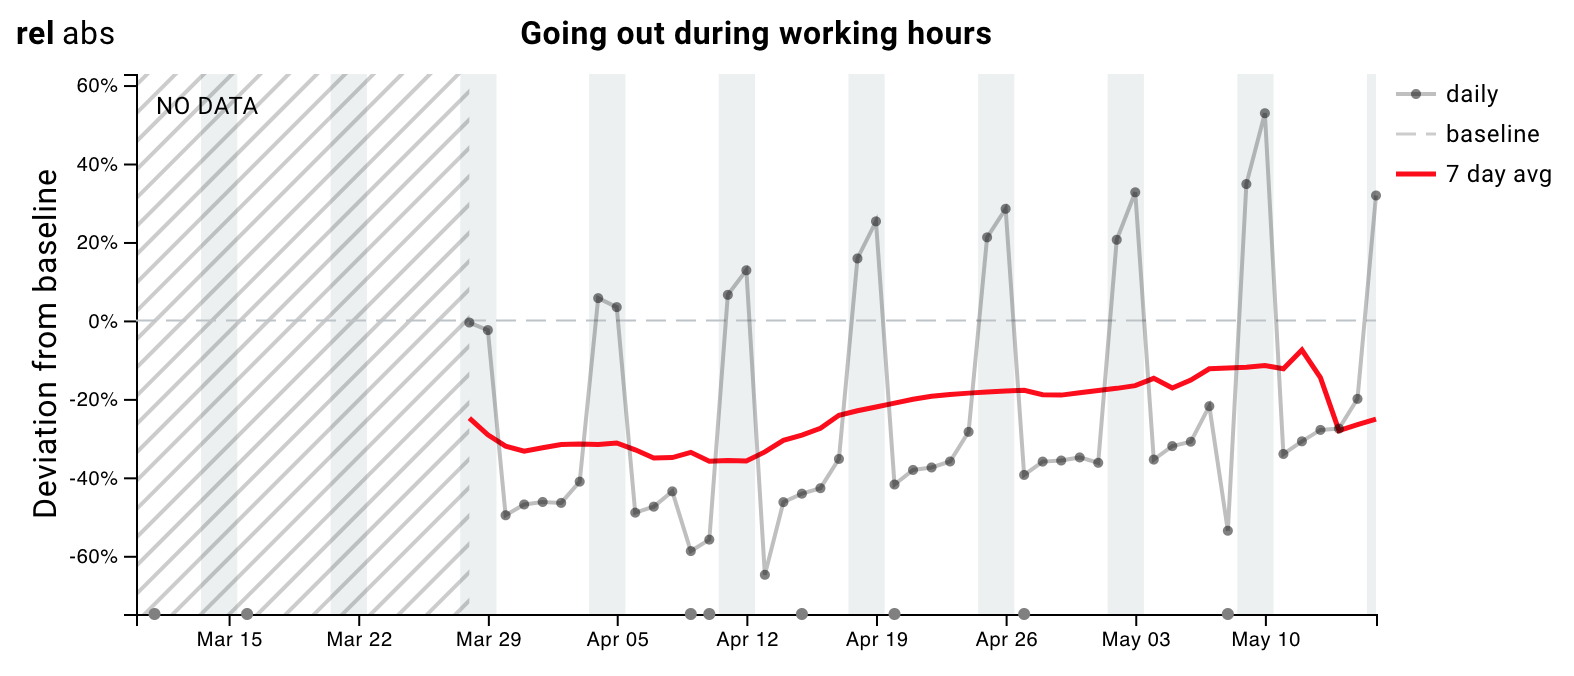
If we pause plotting the absolute numbers of people on the vertical axis and instead focus on relative changes, something spectacular becomes apparent. The figure below shows the relative change of people going out during work hours. During weekdays, the activity is slowly ramping up – from -50% in March to -30% last week. But notice the weekends – the activity is accelerating! This is probably an artifact of the baseline representing activity in February. In the sweet spring sunshine, Danes are attracted to the always-cozy public parks, and nearby forests.
Go explore
You can explore the Going out and Staying home visualizations. For example, see the regional differences for yourself by checking out major cities like Copenhagen and Aarhus and comparing to smaller ones like Holbæk and Guldborgssund.